How to Make Bar Chart Race Videos on iOS and Mac
Armchair Engineering recently released a new app for iOS and Mac, called Step Graph, designed to make creating bar chart race data visualisation videos a very easy process. Below is a quick rundown of the app and its features. There's also a video demonstration available, if preferred.
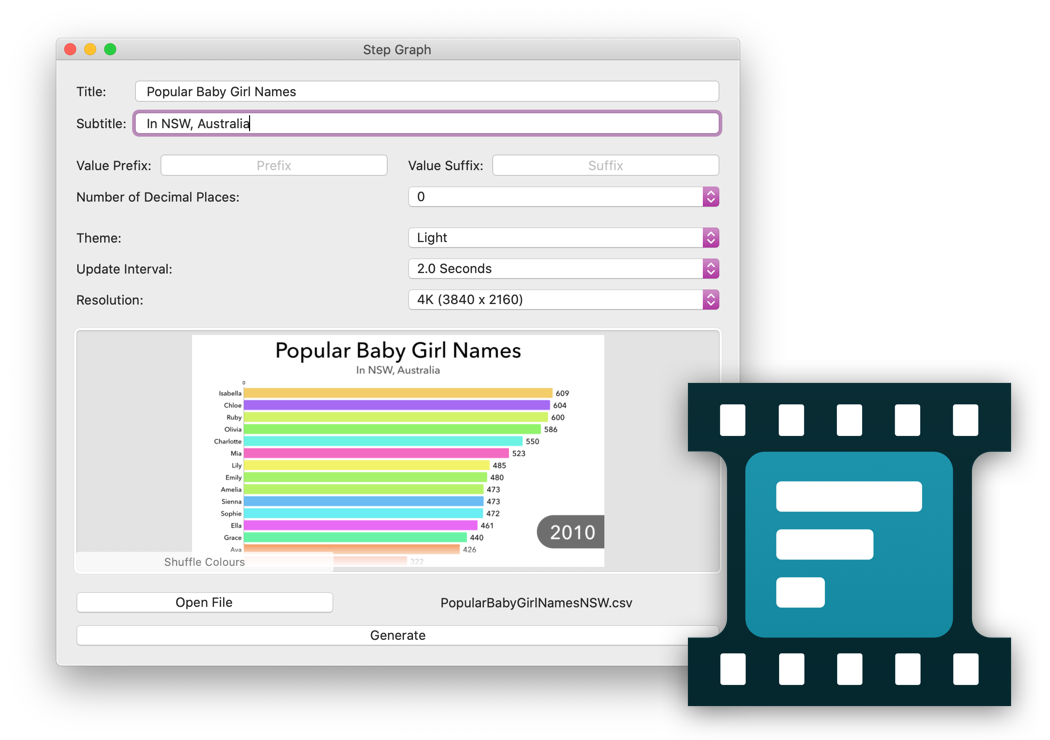
To create a video, the first thing you need to do is make sure that you have your data in a CSV (Comma Separated Values) file format. I have an example here, which is the most popular baby girl names in the state of New South Wales, Australia, over the last decade. To load the data simply drag it into the app, or select Open File.
Aside from the data, there are a number of options that can be tweaked to your liking:
- A title and subtitle can, optionally, be added to the visualisation.
- Chart values can be given a prefix or suffix. For example, when dealing with percentage data a percentage (%) sign can be added on the end.
- The number of decimal places displayed for chart values can be adjusted as needed.
- The default Light appearance can be switched to a Dark theme, for a different look.
- The frequency at which the data changes can be adjusted. That is how long each section of the data is displayed for. The best setting for this will likely depend on the total number of data points in your data set. Larger data sets are likely to work best with a shorter update interval, or else the final video may end up being very long.
- There are four different output video resolutions to choose from. Square videos work well for Instagram.
- The randomised colours can be shuffled if the initial order isn't pleasing. Specific colours can be defined for each bar in the chart by adding colour hex strings in the first row of the data file, this is explained further in the help section of the app.
Once happy with the configuration, simply click Generate, select a destination for the final video and wait a minute or so for it to render. That's it, it's that easy.
Steph Graph is available now of the App Store and is a single purchase (will be accessible on iOS and Mac, no matter which platform you purchased it on).
Happy visualising!
The finished data visualisation